Subscribe to Blog via Email
Good Stats Bad Stats
Search Text
July 2026 S M T W T F S 1 2 3 4 5 6 7 8 9 10 11 12 13 14 15 16 17 18 19 20 21 22 23 24 25 26 27 28 29 30 31 -
Recent Posts
Good Stats Bad Stats
goodstatsbadstats.com
Graphics and When Will it Snow
This is from the National Weather Service and shows the onset times of the snowfall foretasted for the Maryland and Virginia area for January 12-13, 2019.
Let’s improve on the graphics here.
It is unnecessary to plaster all over the image the start times when those times are clearly shown in the labeling of the graphic. Sure people do not read the labels, but putting the time in eight places for the 3-5 pm interval is a bit of overkill.
Next the labels of the chart should be in chronological order. Why start with 5-7 pm, then go to 11 am – 1 pm, followed by 7-9 pm?

Posted in Graphics Visualization
Odds for having 12 sons
Sometimes people never learn. Jacque Wilson, in a piece for CNN titled: Calculating the odds: 12 sons in a row reports the odds at about 1 in 4000.
The problem first is in calculating the odds after discovering an instance of the event. I can’t just flip a coin 12 times, get 12 heads and say the odds of that are one in 4000. Any sequence of flips – heads and tails – is just as likely to happen. We only focus on twelve heads because it appears unique to us. Look at 4000 such sequences and one sequence of 12 heads is likely to happen. The actual odds are (1-0.5*(*12))**4000 of not having an incidence of 12 heads in the 4000 tries. 1-0.5**12 is the odds of it not happening in a single trial. That is very high at 0.9998. but after 4000 trials the odds of not seeing it happen is about 0.37.
With the situation with the twelve sons, the second exponent is not 4000, but the number of women with 12 children.
But it does not stop there as the story could have been written had the reported discovered any woman with a large number of children of the same sex. If the subject of this story come to her attention when she had ten sons she could have written a similar story. With all the possible ways the story could have been generated it is impossible to calculate the exact probability.
And the reporter commits an even graver error. She goes on to note that child number 13 is due in May and then goes on to say the odds of having a 13th son is 1 in 8000. I’m sorry the odds are very close to 1 in 2. The other 12 have already arrived – they have no real influence on the odds of 13th child being a boy or a girl.
Posted in Methodolgy Issues, Statistical Literacy, The Media
“Daddy Bonus” & “Mommy Tax” – or the value of having children
Last May the Center for Latin American, Caribbean & Latino Studies at the City University of New York released a paper titled: The ‘Mommy Tax’ and ‘Daddy Bonus’ Parenthood and Income in New York City 1990 – 2010. The paper included a considerable number of tables on incomes for men and woman both with and without children. The title conveys the image that the authors wanted to put in the public eye. Despite that title the term ‘Daddy bonus’ never shows up in the text of the report while the term ‘Mommy tax’ appears only once. Here the statement was
Among Mexicans there was greater evidence of a pronounced “mommy tax” for women with children, who consistently had lower median personal incomes than all other Mexicans between 1990 and 2010. Education and nativity may play a role in this finding, as Mexicans are an increasing foreign – born population, who typically has lower educational attainment than the domestic – born population
That statement can hardly be construed as implying a tax on woman’s incomes.
This month a second report was released – The ‘Mommy Tax’ and ‘Daddy Bonus’: Parenthood and Personal Income in the United States between 1990 and 2010. In this report they turned the focus from the situation in New York City to data to focus on the United States. They also brought to the forefront the concepts of ‘Daddy Bonus’ and ‘Mommy Tax’ utilizing the terms throughout the report.
There are numerous problems with the reports – the use of the data, and the analysis – or lack of analysis, and the logic used.
Let me start with the basics. When using data in a report the sources of the data should be cited accurately. In this case the claim is that the data comes from the American Community Survey conducted by the Census Bureau. The data in the report is for 1990, 2000, and 2010. There is one problem. The American Community Survey did not exit in 1990 and the sample size in 2000 was clearly not suited to the purposes of the reports. Likely they used the decennial census data for those two points. The American Community Survey matured into a large ongoing survey only after the 2000 Census and by 2010 served as the replacement for the long form that had been a part of the Decennial Census for decades.

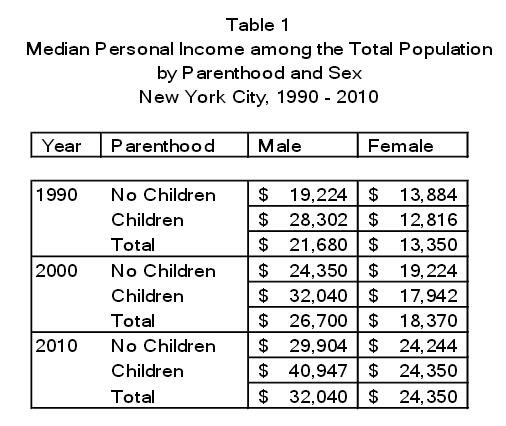 As second very basic issue is with the income levels reported in the study for New York City. Both reports state that income levels have been adjusted for inflation. That is consistent with established practice to report incomes in ‘current dollars.’ But somehow the numbers just do not look right. Table 10 is taken from the recent report for the United states. It shows a decrease in median incomes for men from $36,400 to $34,880 between 1990 and 2010. Meanwhile table 1 from the earlier report for NY City shows a very large increase in median incomes for males for the same time period from $21,680 $32,040. The inconsistency between these number is glaring. How did NY achieve that 50 percent increase in income. The likely explanation is the failure to make the inflation adjustment as claimed in the the NY data.
The ‘Daddy bonus’ claim is highlighted by the following comment in the report:
This finding suggests that men who were parents received a significant ‘daddy bonus’ in their personal incomes when compared to not only women’s incomes, but also to the personal incomes of men who were not parents.
The claim is a bit different when it comes to women:
his finding indicates that working female parents received a large ‘mommy tax’ on their personal incomes when compared to the income levels of male parents.
The authors claimed that the men received a bonus due to having children relative to men without children. They receive a monetary bonus because they have children. But women with children are compared to men with children. So the authors are not saying they are taxed relative to other women for having children. Rather they are claiming some kind of tax on women with children relative to men.
What the authors have is data that shows that men with children have a higher median income than men without children. Somehow they translate this in to a ‘Daddy bonus.’ The authors are making the claim that having children resulted in higher incomes. But where is the logic. Step one in any argument must include evidence that the income levels increased when the children arrived. There is no time series data in report to show that happened. Even if incomes did go up with the arrival of children there need to a causal relationship on the employer side of the equation. Could it be that with the arrival of children the men assumed a greater responsibility and sought out better jobs, or even took a second job to support their new family?
Similarly when claiming a tax on women for having children there needs to be evidence that their income decreased due to the birth of a child. But again no data is presented to show this. Rather the data shows that women in general earned less then men regardless of the presence or absence of children.
In the many tables on the report there are hints at alternative explanations. These include education, employment status, and age. But the pieces are never assembled into a whole picture.
Again this is a case of correlation turned into causation in a way convenient to the authors. When X is correlated with Y then the question can is asked did X cause Y, did Y cause X, did Z cause both X and Y, or is the correlation accidental? That is basic “arguments 101.” All four cases must be considered before any conclusion can be reached. That has not been done on the issue of the ‘Daddy bonus.’
I find the ‘Mommy tax’ issue in many ways as misguided approach. Had the authors dealt with incomes of woman with and without children then they could in some ways claimed to be asking the question: is motherhood taxed? That would be difficult question to answer. Certainly some women forgo income when the choose to have children. Some forgo a job altogether and others choose to work part time. Both of those actions will impact median incomes. The question is how much of an impact those choices have and how much of the disparity has other causes. In placing the focus on men with children vs women with children they had done a disservice to the broader question of the income disparity between men and woman.
The truth is the ‘Mommy tax’ hypotheses only makes sense if women’s income goes down when they have children. But the data shows that even women without children make less than men. So one can not demonstrate the existence of a ‘Mommy tax’ simply by looking at data showing that both women with children and women without children make less than their male counterparts. The reality is much more complicated than that.
Perhaps in addition to a statistics course a basic course it logic and arguments is needed course for those trying to do serious data analysis. Many times the failure is not one of statistical analysis but in the understanding of logic and how to avoid the basic flaws in any argument.